Quantifying Seabed Sediments for Offshore Engineering
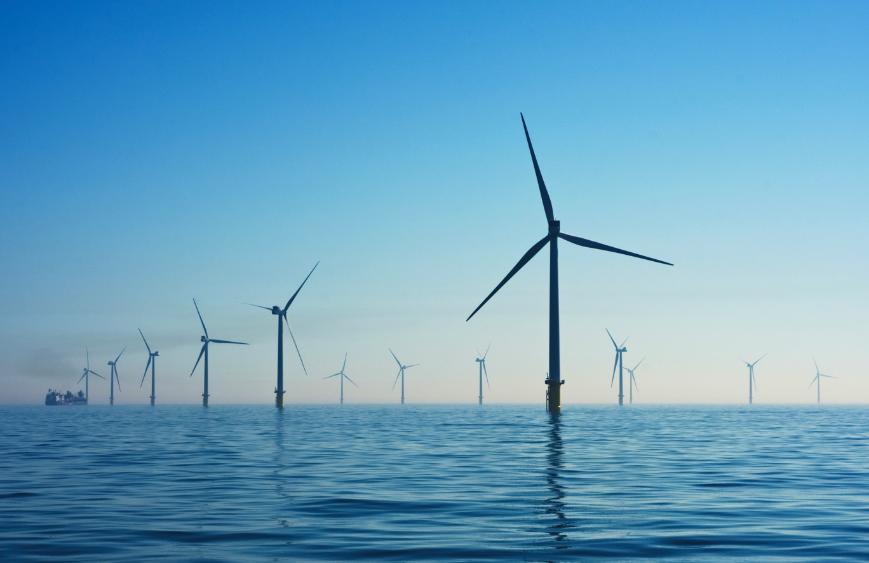
Rampion Offshore Wind Farm, United Kingdom - Picture By Nicholas Doherty
Offshore structures like wind turbines and pipelines need to be installed or anchored to the seabed. Geotechnical engineers have the job of figuring out how to do this, and their first task is always to understand the structure of the seabed sediments at a site. This is not easy because taking measurements of the seabed offshore is expensive and dangerous. For that reason, only a few measurements are available; we say that the data are sparse. Site investigation is even harder in the context of renewable-energy projects, which span larger areas and require many anchors or foundations to be installed. To top it off, the sediments are both highly structured and highly variable. For these reasons, it is crucial to get the best estimate one can, while also quantifying how certain or uncertain the estimate is. In this project, we combine techniques from spatial statistics with knowledge from geotechnical engineering to better solve this problem.
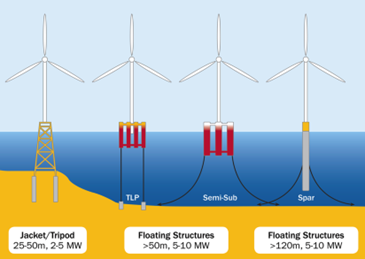
Figure 1: From left to right: A jacket/tripod foundation, a tension-leg platform (TLP), a semi-submersible platform, and a spar for anchoring wind turbines.
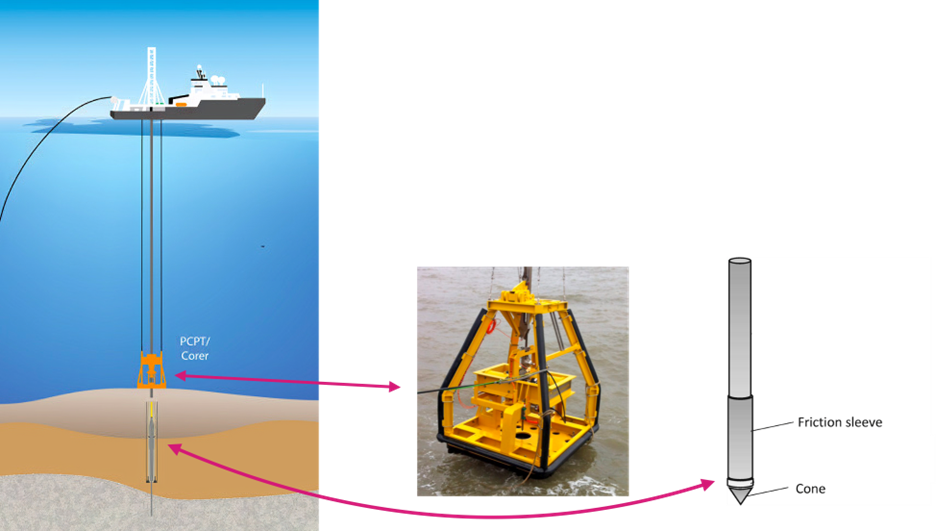
Figure 2: Cone penetrometer test in action (left). Cone penetrometer instrument (middle). Close-up of cone (right).
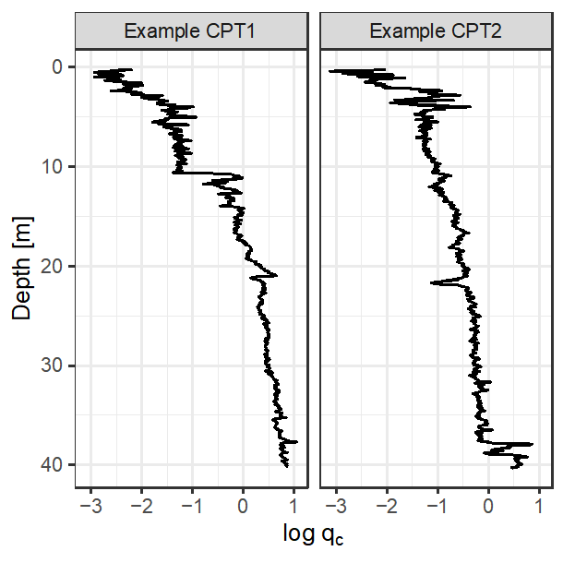
Figure 3: Examples of measurements taken during cone penetrometer tests (CPTs) at one of the sites we investigated.
Figure 1 shows some examples of the kinds of foundations or anchors that might be installed for wind turbines, while Figure 2 shows how the properties of the sediments are measured using cone penetrometer tests (CPTs). In a CPT, a conical instrument is pushed into the ground, returning data on the pressure and friction on the cone. Figure 3 shows two examples of the pressure measurements, which go from the top of the seabed to 40 meters deep. The sediments form in layers, which make the properties change with depth (i.e., they are nonstationary). Adding to the challenge, each CPT returns thousands of measurements, all of which need to be processed.
To address this challenge, we built a method we call GeoWarp. At the core of GeoWarp is a statistical model that breaks down the sediment properties into different components. Mathematically, for a given site, the model is:
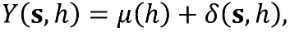
where 𝑌(𝒔, 𝒉) is the sediment property we care about (e.g., pressure) at location 𝒔 and depth 𝒉. This is split into two parts. The first part is the vertical mean profile μ(𝒉), which gives the average value at depth 𝒉 across the site. The second part is ẟ(𝒔, 𝒉), the “deviation process”, which models the detailed, small-scale variations in the sediment properties. To deal with the layered complexity of the sediments, GeoWarp uses a technique called warping to capture nonstationarity (changes in sediment properties at different depths) and anisotropy (differences in properties in different directions).
To test GeoWarp, we used data from six sites on the Northwest Shelf of Australia. This region has complex, highly variable seabed sediments, making it an ideal test case. We applied GeoWarp to data from those sites, each with a few cone penetrometer tests. Figure 4 shows 3D predictions at one of these sites, including the prediction uncertainty. GeoWarp was able to accurately capture the detailed structure of the sediments, providing valuable insights for designing foundations and anchors for offshore structures. Using the same data, we also compared GeoWarp to other state-of-the-art methods and found it gave better predictions.
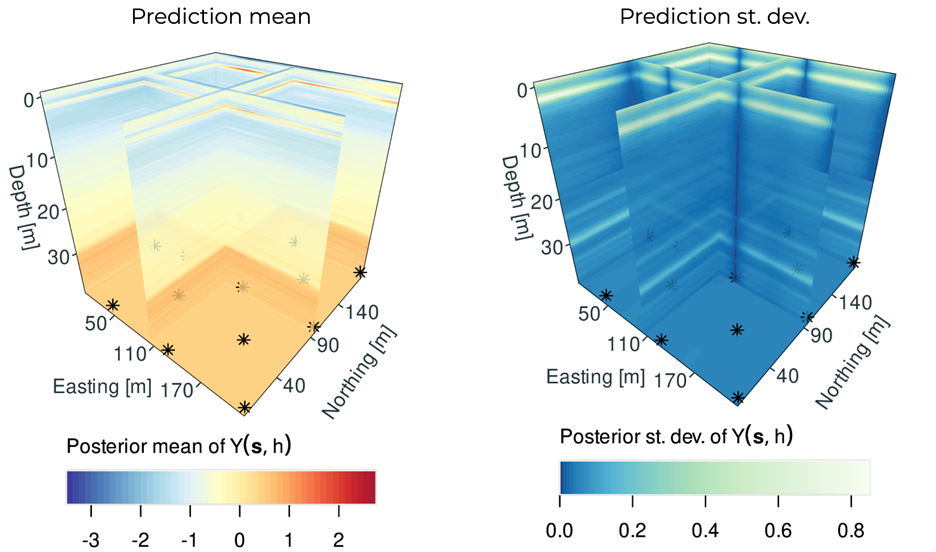
Figure 4: Prediction mean (left) and uncertainty in the form of standard deviation (right) at one of the sites. Slices are shown of the full 3D predictions.
GeoWarp is an example of how collaborations between statisticians and practitioners in another field can lead to good outcomes, in this case in geotechnical engineering. Together, with geotechnical engineers, we were able to use statistical techniques to create a useful tool for them to use. This was put into a software package that is open-source. In the future, we plan to extend GeoWarp, including using data that are often collected at the same time as geotechnical data, such as seismic measurements. These have the prospect of improving the sediment predictions even further.